utu.spectrum.synthesize#
- utu.spectrum.synthesize(contribution, temperature, mass, emission_measure, velocity, shift=<Quantity 0. km / s>, width_nonthermal=<Quantity 0. km / s>, axis_temperature='temperature', axis_velocity='velocity', axis='line')[source]#
Compute the spectral radiance of an optically thin plasma, line by line.
Each line is spread over a range of velocities around its rest wavelength, as a Gaussian whose center is the line-of-sight velocity of the plasma and whose width is that of the thermal motion of its ions added in quadrature to a nonthermal width. The plasma at each temperature has a profile of its own, and the spectrum is their sum,
\[L(\lambda) = \frac{1}{4 \pi} \sum_T G(T) \, \mathrm{EM}(T) \, \phi(\lambda; T),\]where \(G\) is the contribution function, \(\mathrm{EM}\) the emission measure, and \(\phi\) the profile, normalized to unit area. Its standard deviation, in velocity, is
\[\sigma^2 = \frac{k_B T}{m} + \sigma_\mathrm{nt}^2,\]with \(m\) the mass of the ion and \(\sigma_\mathrm{nt}\) the nonthermal width.
The radiance of each bin of velocity is the integral of the profile across it divided by its width in wavelength, not the profile sampled at its center. So the sum of the radiance over the bins is the radiance of the line, however coarse the bins, as long as they span the line. The integral is taken from whichever tail of the profile the bin is in, so it keeps its precision far into the wings.
- Parameters:
contribution (FunctionArray) – The contribution functions of the lines, as
contribution_function()returns them: the rest wavelength of each line along axis as the inputs, and its contribution function along axis_temperature and axis as the outputs.fiascoleaves the ratio of hydrogen to electrons out of these, so the emission measure they go with is that of \(n_e n_H\).temperature (AbstractScalar) – The temperatures of the plasma, along axis_temperature: the ones contribution was computed at. They must be positive.
mass (Quantity | AbstractScalar) – The mass of the ion each line belongs to, such as
fiasco.Ion.mass. Give it along axis to synthesize the lines of several ions at once.emission_measure (Quantity | AbstractScalar) –
How much plasma there is in each bin of temperature, \(\int n_e n_H \, dh\) through the column, along axis_temperature. Every other axis is carried through to the result, such as the two axes of a map.
This is the emission measure of each bin, not the differential emission measure: a DEM per unit \(\log_{10} T\), such as
utu.dem.plowman()returns, has the same units, and has to be converted first: multiplied by the width of each bin in \(\log_{10} T\), or, to integrate it the wayutu.dem.plowman()fits the intensities, weighted withutu.dem.emission_measure().velocity (AbstractScalar) – The vertices of the bins of velocity, along axis_velocity. Positive velocities are away from the observer, to longer wavelengths.
shift (Quantity | AbstractScalar) – The line-of-sight velocity of the plasma. It may vary along any axis of emission_measure, including axis_temperature, and along axis.
width_nonthermal (Quantity | AbstractScalar) – The standard deviation of the nonthermal motions of the plasma along the line of sight. Often quoted instead as the most probable speed \(\xi\), which is \(\sqrt{2}\) times larger. It may vary along the same axes as shift.
axis_temperature (str) – The name of the axis of temperature, summed over.
axis_velocity (str) – The name of the axis of velocity.
axis (str) – The name of the axis along the lines of contribution. Any other argument which varies along it must have one element along it, or as many as contribution.
- Returns:
The spectral radiance of each line in each bin of velocity, along axis, axis_velocity, and every axis of the other arguments but axis_temperature. The inputs are the vertices of the bins, as wavelengths with the rest wavelength of each line beside them.
- Raises:
ValueError – If velocity has no axis axis_velocity or varies along axis_temperature, if temperature or the outputs of contribution have no axis axis_temperature, if a temperature is not positive, or if an argument varies along axis differently than contribution does.
- Return type:
Notes
Nothing here is particular to an instrument: the profile is that of the plasma alone, with no instrumental width, and every line in contribution is synthesized, so choosing which lines are worth including is left to the caller. Natural and pressure broadening are left out, which in the transition region and the corona is a small fraction of a milliangstrom, and so is opacity.
The result is filled in one bin of velocity and one block of lines at a time, with as many lines in a block as keep the largest array along the way under
_size_blockelements. So a map of many lines needs little more memory than the result itself. Where the profile is the same for every line, because none of mass, shift, and width_nonthermal varies along axis, it is computed once for all of them.Examples
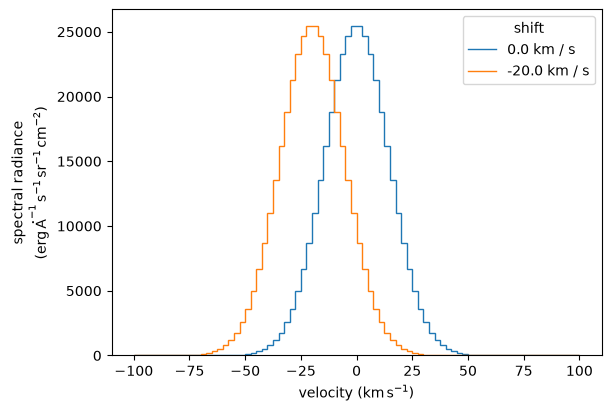
The \(\mathrm{Ne\,VII}\;465\,\AA\) line of plasma near half a million kelvin, at rest and moving toward the observer at \(20\,\mathrm{km\,s^{-1}}\).
import astropy.units as u
import fiasco
import matplotlib.pyplot as plt
import named_arrays as na
import numpy as np
import utu

fiasco.log.setLevel("ERROR")

axis = "temperature"
temperature = na.geomspace(1e5, 1e6, axis=axis, num=21) * u.K

# a Gaussian in the logarithm of the temperature, holding
# 1e27 cm^-5 of plasma in all
weight = np.exp(-np.square((np.log10(temperature / u.K) - 5.7) / 0.1) / 2)
emission_measure = 1e27 / u.cm**5 * weight / weight.sum(axis)

ion = fiasco.Ion("Ne 7", temperature.ndarray)

contribution = utu.spectrum.contribution_function(
    ion=ion,
    density=1e15 * u.K / u.cm**3 / temperature,
    axis_temperature=axis,
)

# the strongest line of the ion
brightest = np.argmax(contribution.outputs.max(axis), axis="line")
contribution = contribution[brightest]

shift = na.ScalarArray([0, -20] * u.km / u.s, axes="shift")

result = utu.spectrum.synthesize(
    contribution=contribution,
    temperature=temperature,
    mass=ion.mass,
    emission_measure=emission_measure,
    velocity=na.linspace(-100, 100, axis="velocity", num=81) * u.km / u.s,
    shift=shift,
    axis_temperature=axis,
)

fig, ax = plt.subplots(figsize=(6, 4), constrained_layout=True)
na.plt.stairs(
    result.inputs.velocity,
    result.outputs,
    ax=ax,
    axis="velocity",
    label=shift,
)
ax.set_xlabel(f"velocity ({u.km / u.s:latex_inline})")
ax.set_ylabel(f"spectral radiance\n({result.outputs.unit:latex_inline})")
ax.legend(title="shift");